Jordan Lake Bird Counts–Part 1
Author: Norm Budnitz
[This is the first in a series of blog articles presenting the bird count data from the Jordan Lake Spring and Christmas Bird Counts. This article explains how the counts work and presents data on several species of birds whose populations are directly tied to the lake. Future articles will explore other groups of species.]
Introduction
New Hope Audubon sponsors two bird counts each year in a 15-mile diameter count circle centered in the area of Jordan Lake in Chatham County.
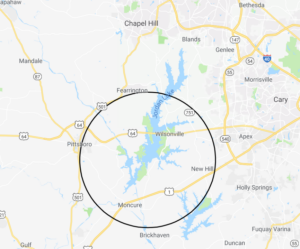
Figure 1. Jordan Lake Count Circle
Figure 2 is an interactive map that shows the count areas that are covered by individual teams of counters. You can zoom in and out and click on specific count areas for descriptions.
Figure 2. Jordan Lake Count Circle showing count areas
The count is done on one designated day, often starting early in the morning, lasting 6 or more hours, and is restricted to the designated count circle. We try to count every individual bird of every species we encounter, seen or heard. The Spring Bird Count (SBC) date is usually the first Sunday in May. In winter, the count is either the last Sunday in December or the first Sunday in January. The winter count is part of a much larger effort called the Christmas Bird Count (CBC) organized by the National Audubon Society.
We have been doing the Jordan Lake counts every year since 1977. As a result, we have compiled a significant amount of data and can now see some trends in what has been happening to the bird populations in the area. These data are available in Excel spreadsheets that can be downloaded by clicking on these links: cumulative SBC data and cumulative CBC data.
Counters are organized into small groups, each group covering one of the areas outlined in the map above. Note that some areas cover parts of Jordan Lake directly (e.g., Ebenezer Point, Vista Point, and Crosswinds Marina), other areas cover tributaries to the lake (e.g., White Oak Creek, Haw River, and Beaver Creek), and other areas are not even part of the Jordan Lake basin at all (Harris Lake, Moncure, and the Deep River). This is because the count circle was set up according to the 15-mile diameter guidelines established by National Audubon.
The counters report the name and number of individuals of every species they encounter on count day. But there are effort variations in the data from year to year as a result of the following:
- Weather (heavy cold rain versus clear, mild temperatures, for example)
- Lake levels (high lake levels limit access for observing birds)
- Number of individual counters
- Number of parties in the field
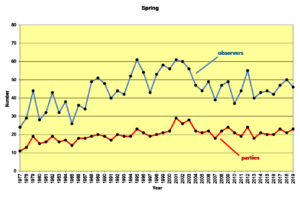
Figure 3.
Figure 3 is a graph showing the number of counters and the number of parties for the SBC since 1977. Note that the number of counters has averaged around 45 since the 1990s, and the number of parties has averaged around 21 since about that same time. That consistency is a good thing for comparing data over the decades. For the analyses discussed below and in future articles, sometimes I will use Christmas/CBC data (green graphs), and sometimes I will use Spring/SBC data (yellow graphs) for clarity or brevity.
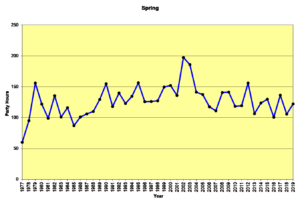
Figure 4.
Figure 4 shows the time spent in the field each spring—the total party hours. This number varies more than the preceding two, being more dependent on weather issues. The number of parties may be similar each year, but when the counters get cold and wet by 10:00 AM, they tend to get a bit whiny and want to go home and get warm and dry. Our counters are all volunteers; they are not getting paid big bucks to endure harsh conditions. As a result, most of the graphs presented below use birds per party hour as a measure of effort (the number of individuals divided by the number of party hours). This makes it easier to compare data from year to year.
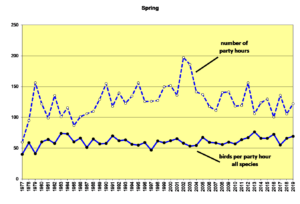
Figure 5.
Figure 5 has two lines. The upper line shows the number of party hours (same as Figure 4), while the lower line shows birds/party hour for the total number of individual birds of all species recorded for each year. The upper line shows the variation in effort over the years, while the lower line is ‘damped down.’ Rather than using the actual number of individual birds, we will use this effort-adjusted value for looking at trends over time in the graphs below. This will make those comparisons more meaningful.
[Note: The horizontal axis in all these graphs will be the timeline from 1977 to the present—i.e., from the beginning of the counts to the present. The scale of the vertical axis will vary depending upon the number of birds reported—i.e., graphs of species with large populations will have a different vertical scale from graphs of species with smaller populations. However, when SBC data are compared to CBC data for a given species, those two graphs will usually have the same vertical scale.]
Water Bird Examples
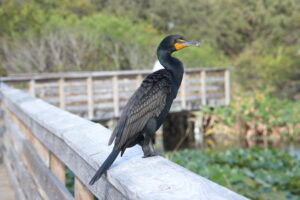
Double-crested Cormorant (photograph, Norm Budnitz)
Double-crested Cormorant (Phalacrocorax auritus)
The graphs of SBC and CBC data for Double-crested Cormorants are good examples that show change through time. Figure 6 is a graph of the SBC data.
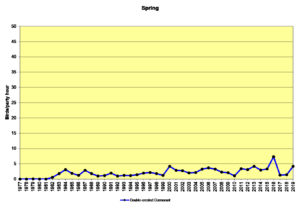
Figure 6, SBC, Double-crested Cormorant
The construction of the lake by the US Army Corps of Engineers began in the early 1970s. The lake level was set at about 160 feet above sea level for the first few years and then raised to its current level of 216 feet above sea level in 1982. Because the lake is managed by the Corps and allowed to fluctuate for flood control of communities downstream, this level does change in periods of drought and periods of heavy rains. Note that the cormorants ‘found’ the lake at about the time it reached its stable level.
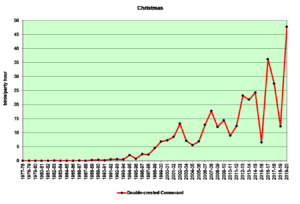
Figure 7, CBC, Double-crested Cormorant
Figure 7 shows the CBC numbers for cormorants. Note that it took a while for the wintering cormorants to ‘find’ the lake and then to build up their winter population numbers. Most of these wintering birds move in from points further north. Perhaps this increase in population size is an indication of the ‘maturation’ of the lake over time. As the fish numbers have increased and stabilized, so have the number of cormorants, their predators.
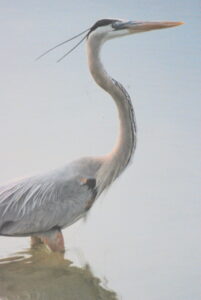
Great Blue Heron (photograph, Norm Budnitz)
Great Blue Heron (Ardea herodias)
These two graphs, Figures 8 and 9, show the spring and Christmas count data for Great Blue Herons.
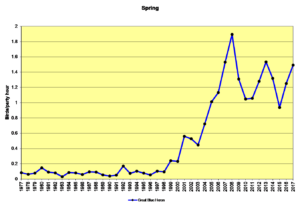
Figure 8, SBC, Great Blue Heron
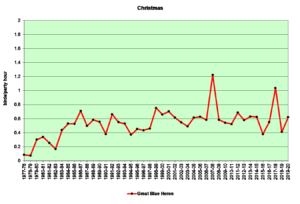
Figure 9, CBC, Great Blue Heron
These birds are year-round, permanent residents. Note that the spring numbers began to rise around the year 2000. This was probably about the time that nesting colonies began to form around the lake. The winter numbers were higher in the early years of the lake, probably due to birds moving in from surrounding areas as soon as the lake formed. Also note the larger number of herons in spring versus winter in recent years. There is a bulge in the numbers in spring with nestlings and fledglings. These young birds are particularly vulnerable to accidents and predation, so there is significant mortality of these young birds by the time we count again in the winter.
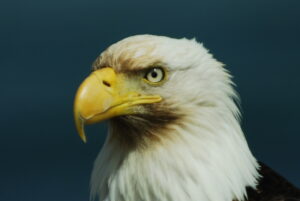
Bald Eagle (photograph, Norm Budnitz)
Bald eagle (Haliaeetus leucocephalus)
For Bald Eagles, Figures 10 and 11 use number of individuals rather than birds/party hour on the vertical axis. This makes it easier to compare results with New Hope Audubon’s quarterly eagle counts described below.
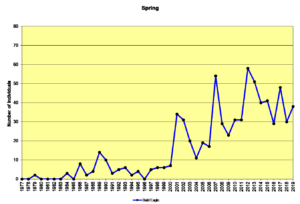
Figure 10, SBC, Bald Eagle
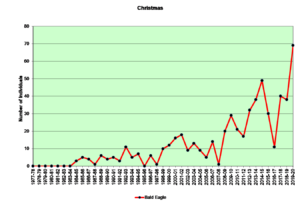
Figure 11, CBC, Bald Eagle
As was the case with the cormorants, the eagles seem to have ‘found’ the lake when it reached its stable level in the early 1980s. These pioneer birds probably came from breeding populations in Florida and Chesapeake Bay during their annual post-breeding dispersal when young birds move away from the territories held by their parents. There are now several breeding pairs with nest sites scattered around the lake (also at Falls Lake, north of Raleigh). As the graphs show, the numbers of eagles have risen dramatically in recent years. Bald Eagles are fish eaters and are attracted to large lakes, particularly lakes with large shallow areas as is the case at Jordan.
In addition to the spring and Christmas counts, New Hope Audubon has been conducting quarterly Bald Eagle counts using a different protocol. The latter are point counts. Separate parties go to specific sites on a specific day and count all eagles they see from 7:00 AM to 8:30 AM, rain or shine. Since all parties are counting at the same time, these counts are essentially snapshots of the lake, likely eliminating most duplicate counting. It is encouraging to compare the data from these two types of counts as shown in the next two figures.
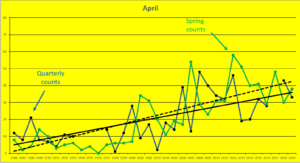
Figure 12, SBC and April Quarterlies, Bald Eagle
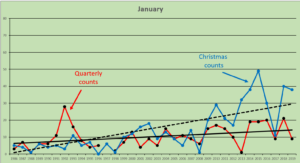
Figure 13, CBC and January Quarterlies, Bald Eagle
These graphs compare the spring counts with the April quarterly counts (Figure 12) and the Christmas counts with the January quarterlies (Figure 13). Trend lines are included in these graphs to aid in the comparison. They are remarkably similar, indicating that both counting methods are revealing the same trends. (How nice for this reporter!)
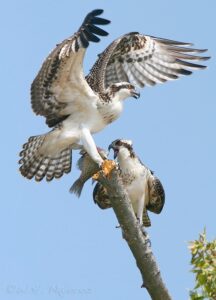
Osprey (photograph, Bill Majoros)
Osprey (Pandion haliaetus)
Ospreys are migratory birds. They breed on Jordan Lake, but they all but disappear in the winter, migrating south (only a half dozen winter records). Figure 14 shows that these piscivorous (fish-eating) birds seem to be thriving on the lake.
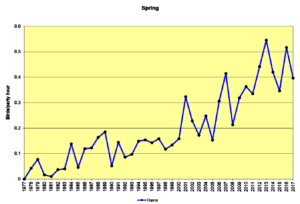
Figure 14, SBC, Osprey
Bald Eagle and Osprey populations suffered in the mid-1900s, when DDT became widespread as a pesticide. DDT in lakes was taken in by tiny plants and animals (plankton). These organisms were then eaten by small fish that were in turn eaten by larger fish, thus accumulating DDT in their tissues. When Bald Eagles and Ospreys ate these fish, they received large doses of DDT. The result was that their eggs became fragile and would break in the nest. Their populations declined precipitously. After DDT was banned in the United States, these birds (and many others) made remarkable comebacks. All this was brought to light in Rachel Carson’s ground-breaking book, Silent Spring (1962). Carson and her book were influential in the modern environmental movement and the creation of the US Environmental Protection Agency (EPA). And now we get the great pleasure of seeing Bald Eagles and Ospreys at Jordan Lake.
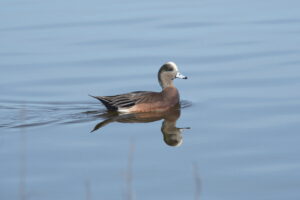
American Wigeon (photograph, Norm Budnitz)
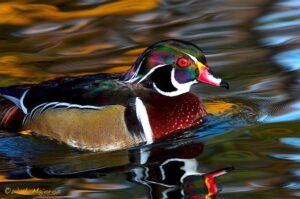
Wood Duck (photograph, Bill Majoros)
Ducks
: Many ducks of a variety of species spend the winter on Jordan Lake. Most of these species breed further north in North America and move south as the lakes freeze. Species that have occurred on the lake at least once include Wood Duck, Blue-winged Teal, Northern Shoveler, Gadwall, American Wigeon, Mallard, American Black Duck, Northern Pintail, Green-winged Teal, Canvasback, Redhead, Ring-necked Duck, Greater and Lesser Scaup, Surf and White-winged Scoter, Long-tailed Duck, Bufflehead, Common Goldeneye, Hooded, Common and Red-breasted Merganser, and Ruddy Duck. Figure 15 is a graph of all the duck species lumped together. In general, we averaged 2-6 birds/party hour most years. However, in the 1989-90 CBC approximately 500 Mallards appeared on the lake, and in the 1993-94 CBC approximately 1,500 Ring-necked Ducks and 200 Hooded Mergansers showed up. We have no explanation for these unusual numbers.
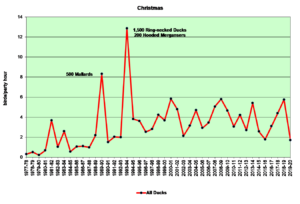
Figure 15, CBC, All Ducks
Other Species: In addition to the species mentioned above, the following water birds show up on the CBC in winter or sometimes on the SBC in spring. Some are annual visitors while others are rare, only occurring occasionally, as noted: Snow Goose (twice), Canada Goose (annual), Tundra Swan (once), Pied-billed Grebe (annual), Horned Grebe (annual), Red-necked Grebe (twice), Eared Grebe (four times), American Coot (almost annual), Bonaparte’s Gull (annual), Ring-billed Gull (annual), Herring Gull (annual), Glaucous Gull (twice), Iceland Gull (once), Lesser Black-backed Gull (9 times since 2002), Great Black-backed Gull (9 times since 2002), Forster’s Tern (12 times, spring and Christmas), Caspian Tern (15 times in spring), Common Tern (once in spring), Red-throated Loon (three times), and Common Loon (annual).
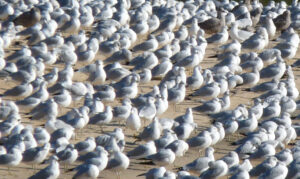
Ring-billed Gulls (photograph, Norm Budnitz)
The gull story is fascinating and has been discussed in previous blog articles, so I won’t repeat it here, except to say that since the opening of the South Wake County Landfill in 2008, the numbers of gulls have exploded, reaching as high as 65,000 in 2011. The numbers have since decreased, but we still count tens of thousands each winter. Clicking on these titles will take you to those previously published articles: Gull Poop (2017), Jordan Lake Gulls Revisited (2019), and Jordan Lake Gulls Revisited—Revisited (2020).
[Future articles in this series will look at land birds, paying particular attention to species whose numbers have increased and, more ominously, those whose numbers have decreased. Watch this space.]
« Back to All Press