JORDAN LAKE BIRD COUNT DATA
You may use this page to do some interactive searching through all the years of our Jordan Lake Spring and Christmas Bird Count data. The horizontal axis is the years from the inception of the counts (1977) to the most recent data we have. The vertical axis is birds per party-hour. Because we have different numbers of observers, and they count for different amounts of time from year to year, this metric allows for a better comparison of ‘birds per unit effort’ over time. For a more detailed explanation of this rationale, see this blog article. The scale of the vertical axis is automatically determined by the maximum number of individuals of the chosen species ever reported over the span of a given count.
Note: We did not hold a spring count in 2020 because of the COVID-19 pandemic. As a result, in the spring graphs there will be a gap for that year–no data, so no data points.
INSTRUCTIONS FOR GENERATING CHARTS:
- To generate a chart of the data for a particular bird species, you may start typing its name in one of the boxes below the photographs. The program will suggest some names for you. Click on the one you want. Alternatively, you may click the down arrow in one of the boxes and scroll through the list of birds arranged in taxonomic order. Only species that have been reported on these counts are listed.
- Once you have chosen a species, by clicking on either or both square check boxes, you may choose to see a graph of its Spring Bird Count data, a graph of its Christmas Bird Count data, or two graphs showing both sets of data for comparison.
- You may also compare two species by entering different names in each of the two boxes. This will generate two seasonal graphs with two lines, one for each species.
- Pay attention to the scales on the vertical axes. Some species are much more common in one season than the other. Also, when comparing two species, the vertical axis scale is determined by the more numerous species.
DOWNLOAD THE SPREADSHEETS
You may download the spreadsheets that these charts are based on by clicking the following links. If you have questions, please use the “Contact Us” link at the bottom of the page and include “bird count charts” in your message.
- Cumulative data from Jordan Lake Spring Bird counts (MS Excel format)
- Cumulative data from Jordan Lake Christmas Bird counts (MS Excel format)
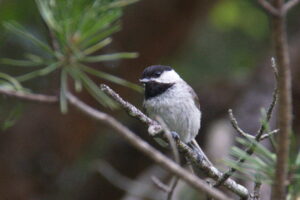 Carolina Chickadee -Photo by Norm Budnitz
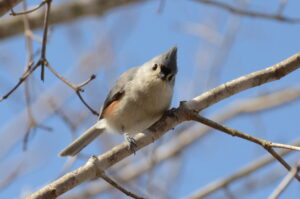 Tufted Titmouse -Photo by Norm Budnitz